Making Sense of Real-Time Factory Data
Making Sense of Real-Time Factory Data
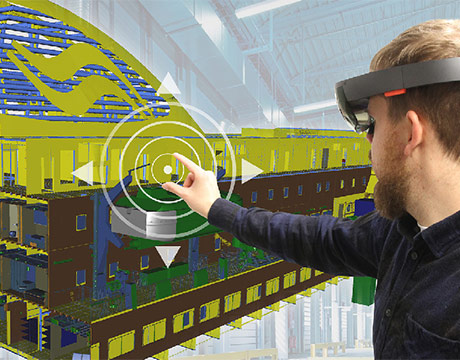
New software helps manufacturing decision-makers get the big picture into factory operations. Image: Fraunhofer IGD
The fourth industrial revolution is right around the corner. With it will come a constant stream of information that will flow continually to and from manufacturing command centers. It will need to be interpreted quickly and presented in ways people can easily understand both intuitively and visually.
Now, researchers at the Fraunhofer Institute for Computer Graphics Research have developed a tool to help manufacturers make sense of all of that real-time information.
Industry 4.0 promises tools that let manufacturers see and immediately understand how their factories are functioning in real time. Those new tools include sensors, software, and connected and automated systems, the Internet of Things, and cloud computing. This combination gives manufacturers immediate access to all types of data that flows to and from their factory. From the largest machine to the smallest bits of information, almost every factory operation will be connected.
For You: The Comeback of the Aluminum Can
The Fraunhofer Institute’s Plant@Hand3D displays constant feedback delivered by tooling machines, sensors, PLCs, and all other monitored processes. The software animates the data in a visual form that’s easy to understand. It also helps decision-makers see the big picture, says Mario Aehnelt, head of the department visual assistance technology at Fraunhofer IGD in Darmstadt, Germany.
The software helps decision-makers see the big picture.
“We overlay key performance indicators on top of the real factory production line – visualizing, for example, the status of production – to let decision makers know about potential problems and how to act correctly and quickly,” Aehnelt says.
After all, columns of numbers and spreadsheets won’t help with the instantaneous decision making and cost savings future factory technologies will enable.
The information is displayed on what Aehnelt calls a multi-touch table. The table is flat with a big, clear display showing the animated graphics. It’s like those old-school, seated Pac-Man games still occasionally seen at restaurants and bars. Only this display is much clearer and bigger, and the graphics put the Pac-Man ghosts to shame. It also depict plant functions in 3D.
Trucks and robots move like cartoon figures across the screen, but there is nothing childlike about the real-time information they depict. The software also marries the data from various factory systems, such as production data from manufacturing, ERP, or data from personnel planning, he adds.
Plant managers traditionally get feedback separately from their production systems, evaluate it, and then move on to look at their production-management system. In other words, managers can’t see and evaluate feedback from their entire factory. They can’t determine how the factory operates as a whole, Aehnelt says. Getting that information in a way that’s easy to visualize can have a huge impact on the decision making process.
The information depicted by Plant@Hand3D can also be used to predict factory performance. A manager, for example, could see what will happen with production if the plant installs a new robot or changes a process. The visualization would depict all systems in such a case, including shipping and invoicing, Aehnelt says. A manager can see, for example, a problem with the line and immediately trace it back to its source, which could be a malfunctioning robot or a problem with a particular part that can be quickly swapped out.
By making particular hand and finger gestures, managers can zoom in on a specific machine or look at an overview of production data from a particular plant or line, Aehnelt says. Managers and plant production personnel can also collaborate on decisions by working on distributed screens, which can be placed in production areas.
Being able to visualize data from different systems makes it easy to grasp the information given and to initiate actions accordingly, he adds.
“The intuitive interaction with data is important. We see a big advantage in that,” Aehnelt says.
Jean Thilmany is an independent writer.
Read More:
3D Printing Trains Bomb-Sniffing Dogs
Leveraging Human Vision to Sharpen Machine Sensing
The Great Ocean Cleanup Begins
We overlay key performance indicators on top of the real factory production line to let decision makers know about potential problems and how to act correctly and quickly.Mario Aehnelt, Fraunhofer IGD
New software helps manufacturing decision-makers get the big picture into factory operations. Image: Fraunhofer IGD
Related Content


